COVID-19 in Russia


Stepan Zemtsov,
Director,
The Centre for Economic Geography and Regional Studies, Russian Presidential Academy of National Economy and Public Administration (RANEPA),
Moscow, Russia
Vyacheslav Baburin,
Professor,
Department of Economic and Social Geography of Russia, Lomonosov Moscow State University (MSU),
Moscow, Russia
The COVID-19 pandemic caused serious loss around the world, 167 million cases of infection (2.1% of the population), and 3.47 million deaths (2.08% of the cases), as of May 23, 2021. In Russia, 5 million cases (3.42% of the population) were confirmed, and 0.118 million (2.36% of the cases) died according to Rospotrebnadzor. For comparison, Sweden – 10,4% cases per capita, the USA – 10, Lithuania – 9,9, Estonia – 9.6, Spain – 7.7, Latvia – 6,9, the UK – 6.6, Germany – 4.3. Russia was among the leaders in detectability, or tests per capita, in 2020 according to ‘Our world data’. The high rate of the COVID-19 spread can be explained by high population density and mobility, and its consequences could be intensified due to the aging.
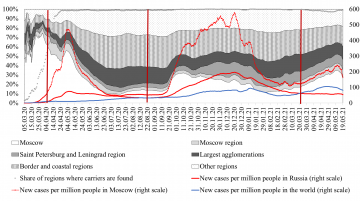
The first confirmed cases in Russia were recorded on March 15 in 2020 (see the figure): Italian tourists in Moscow and Chinese workers in the Far East. At the first stage, carriers infected abroad were concentrated in large agglomerations and in coastal and border areas. On March 30, Russia closed international air traffic and imposed restrictions on the border; 30-day vacation for majority of professions were announced until April 30. These measures were considered as premature and excessive by some experts, but they turned out to be late. By mid-April 2020, the cases were observed in all Russian regions. The mandatory wearing of masks and gloves, travel bans and digital passes have been introduced. Many small businesses (retailers, hotels, restaurants, etc.) were temporarily closed. Students switched to distance learning, which created certain problems, especially in rural areas. However, the disease was actively spreading due to the return of temporary workers, as well as summer residents from agglomerations to small settlements. The number of cases has sharply increased in the northern mining regions, where temporary labour migrants moved for summer jobs. By mid-May, in Moscow, the number of new cases began to decline; it gradually decreased all over the country during the summer, reaching a minimum at the end of August. Most of restrictions have been lifted. In September, with the return of students and summer residents to big cities, a second wave begins. The authorities encouraged businesses to use remote employment. Many regions were forced to return some restrictions, but their severity was significantly lower. The second wave reached its peak by mid-December due to cold weather and New Year’s sales. A decrease in the incidence rate was observed until the end of March 2021. The government has allowed flights to some tourist countries. The third wave signs appeared with increased international and interregional mobility. Moscow has seen steady cases’ growth since late March 2021.
The highest total incidence rate in Russia is observed in the largest agglomerations as centres of business life, migration and tourism: Moscow and St. Petersburg (9 and 8% of the population), in old-developed regions near agglomerations, where summer residents go: Pskov, Novgorod, Oryol regions (>4.7%), in the northern mining regions with many temporary labour migrants: Yamal-Nenetsky, Murmansk, Magadan, Sakhalin (>4,6%), and in underdeveloped regions: Tyva, Altai, Kalmykia, Karachay-Cherkessia (>4,3%). The population of the latter could not fully comply with anti-epidemic measures due to the weak development of remote work, distance learning, and lack of funds; the people did not fully believe the authorities.
The data on recorded mortality from COVID-19 can be distorted by the quality of tests, post-mortem diagnosis and other factors. For example, there is an opinion that local authorities tend to underestimate the number of deaths in order not to increase panic, to show better results for the federal authorities, etc. In addition, live data may be incomplete and lagging. Therefore, we use data on excess annual mortality: a comparison of this year mortality and previous ones. It also includes incidental deaths due to lack of assistance, overcrowding hospitals, etc. In Russia, the additional mortality rate in 2020 was 27%, this is the 20th place out of 94 countries (according to The World Mortality Dataset). For comparison, Peru – 140%, Mexico – 58%, Brazil – 32.4%, Czechia – 28.7%, Poland – 26.3%, Lithuania – 23.1%, Spain- 21%, the USA – 20.7%, Italy – 17.1%. Excess mortality was higher in the least developed Russian regions with weak development of health care: Chechnya (58%), Dagestan, Ingushetia (>43%), in the largest agglomerations with an aging population and high density of hospitalized: Moscow, St. Petersburg, Samara, Tatarstan (>33%), and in the mining regions Yamalo-Nenetsky, Khanty-Mansi regions (>33%) (according to Rosstat data).
The epidemic affected Russia more than the world average but less than most East-European countries; Moscow is among the most affected worldwide. As a result of the epidemic, a special healthcare infrastructure was created in certain regions, numerous electronic services were developed (digital passes, telemedicine, distance education, etc.), and many businesses were digitalized. The authorities have learned to respond faster to crises. However, it also sharpened the debate about digital totalitarianism (unfreedom) and privacy. Of course, the questions are being discussed how justified were the restrictive measure, although at the beginning it was about excessive restrictions, at the end – about ‘exchanging lives for economic growth’.
Three waves of the COVID-19 in the Russian regions and worldwide (7-day rolling average)

Sources: Rospotrebnadzor; Our world in data; Zemtsov S., Baburin V. (2020). COVID-19: Spatial Dynamics and Diffusion Factors across Russian Regions. Regional Research of Russia, 3(10), 273–290.
Email: spzemtsov@gmail.com
Email: vbaburin@yandex.ru
Expert article 2954
> Back to Baltic Rim Economies 3/2021
To receive the Baltic Rim Economies review free of charge, you may register to the mailing list.
The review is published 4-6 times a year.
