Datasets and codes
During the years, we have accumulated different kinds of data sets related to the biodiversity in Amazonia and other tropical areas.
Biological datasets
Ferns, lycophytes and Melastomataceae
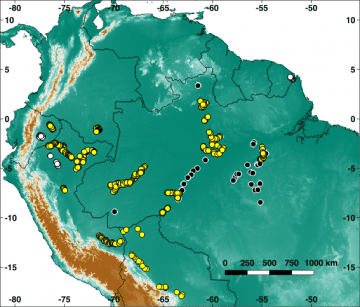 We started making floristic inventories focused on ferns, lycophytes and Melastomataceae in 1990 and are still continuing. Most of the data comes from quantitative transects that are either 2 m or 5 m wide and often 500 m long, but there are some that are longer (up to 43 km), and some sites have been sampled with compact plots rather than elongated transects. Almost all sites have also been sampled for soils. Over the years, numerous students and colleagues have contributed to the database. The yellow dots indicate sites inventoried for all plant groups, white and black dots sites with fern and lycophyte data only. Black sites were inventoried under the PPBio program and the data was later harmonised and incorporated to the Amazon Team database. Interested in contributing your own data? Have a novel idea on how the data could be used? Contact us!
Queries: Hanna Tuomisto (ferns and lycophytes), Kalle Ruokolainen (Melastomataceae), Gabriela Zuquim (PPBio data)
Ichneumonid wasps (Amazonia and tropical Africa)
![]() We have collected flying insects with Malaise traps for a total of several years in Amazonia and tropical Africa. The material contains an estimated 140,000 ichneumonoid wasps and an unknown number of other invertebrates. Only a few ichneumonid subfamilies have been processed and are ready for use. Our African sampling also includes weather and vegetation data, and hand-netted ichneumonoids stored in DNA-preserving 99% ethanol.
We have collected flying insects with Malaise traps for a total of several years in Amazonia and tropical Africa. The material contains an estimated 140,000 ichneumonoid wasps and an unknown number of other invertebrates. Only a few ichneumonid subfamilies have been processed and are ready for use. Our African sampling also includes weather and vegetation data, and hand-netted ichneumonoids stored in DNA-preserving 99% ethanol.
Datasets related to the African sampling will gradually appear in the Zenodo repository: https://zenodo.org/communities/uganda2014-2015
Queries: Ilari Sääksjärvi (Amazonia), Tapani Hopkins (Africa)
Preserved specimens
Full set of our collections has been deposited at the University of Turku Natural history museum.
Sets of our plant and animal collections have been deposited in the following herbaria or zoological collection in their country of origin:
Brazil: Instituto de Botânica (SP), Instituto Nacional de Pesquisas da Amazônia (INPA), Jardim Botânico do Rio de Janeiro (RB). Bolivia: Herbario Nacional de Bolivia, Universidad Mayor de San Andrés (LPB). Colombia: Instituto Amazónico de Investigaciones Científicas SINCHI (COAH). Costa Rica: Museo Nacional de Costa Rica (CR). Ecuador: Pontificia Universidad Católica del Ecuador (QCA), French Guiana: Herbario Nacional del Ecuador (QCNE), Institut de Recherche pour le Developpement (CAY). Mexico: Universidad Nacional Autónoma de México (MEXU). Panama: Universidad de Panamá (PMA). Paraguay: Universidad Nacional de Asunción (FCQ). Peru: Instituto de Investigaciones de la Amazonia Peruana (HH), Universidad Nacional de la Amazonia Peruana (AMAZ), Universidad Nacional Mayor de San Marcos (USM), Universidad Nacional de San Antonio Abad del Cusco (CUZ). Suriname: University of Suriname (BBS). Uruguay: Museo y Jardín Botánico (MVJB).Venezuela: Universidad Central de Venezuela (VEN).
Queries: Samuli Lehtonen (plants), Ilari Sääksjärvi (insects).
Remote sensing and environmental products
Amazon-wide Landsat TM/ETM+ composite
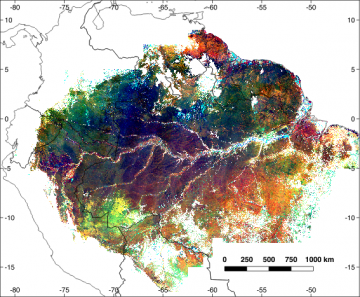 We have produced a Landsat image composite based on all sufficiently cloud-free Landsat TM and ETM+ images taken in July-September of the years 2000-2009. The composite retains the full 30-m resolution of the original Landsat images and has succeeded in producing almost seamless surfaces especially for the infrared bands. The composite has been deposited in the IDA server.
Queries: Jasper Van doninck, Hanna Tuomisto
Soil map using indicator species
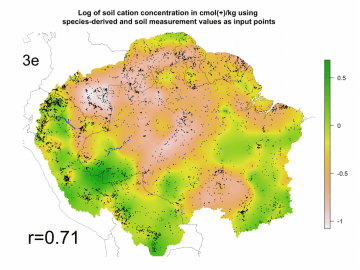 We generated exchangeable cation concentration maps using both direct and indirect soil data as input points for interpolation using ordinary Kriging. We validated the maps using external soil information from 194 plots of the Amazon Forest Inventory Network (RAINFOR).
The maps can be found here. The methodology is presented in detail in Zuquim et al. 2019.
Predictive map of floristic variation of trees in Peruvian Amazonia
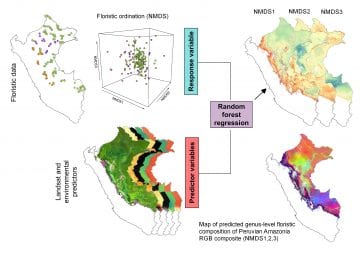
We spatially predicted the main floristic gradients of trees at genus level (each of the first 3 axis of a NMDS) throughout Peruvian Amazonia. We combined floristic data from the Peruvian national forest inventory data together with remote sensing and environmental layers using random forest algorithm.
The predicted maps of floristic variation of trees in Peruvian Amazonia are freely available for download here. More information regarding the methodology is presented in detail in Chaves et al. (2020)
Codes and R packages
Generate soil map using indicator species-derived values
 These codes can be accessed in github (click here) and support publication Zuquim et al. 2019. It allows the user to calculate species optima and produce a exchangeable cation concentration map.
horizon: Horizon Search Algorithm (R package)
Calculates horizon elevation angle and sky view factor from a digital terrain model (Dozier and Frew, 1990).
Available here
solarPos: Solar Position Algorithm for Solar Radiation Applications Calculations (R package)
Calculation of solar zenith and azimuth angles.
Available here