A Catalog of quasar properties from SDSS DR14: Supplementary material
Rakshit et al. (2020), ApJS, accepted for publication in ApJS ( ArXiv )
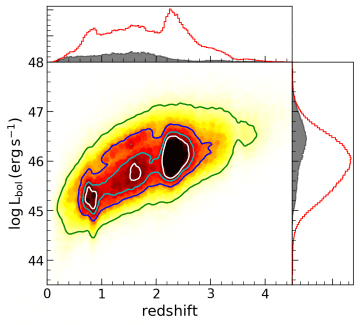
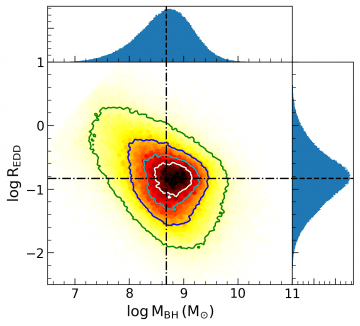
This page provides supplementary material of quasar properties presented in Rakshit et al. (2020). We present measurements of the spectral properties for a total of 526,265 quasars selected from the fourteenth data release of the Sloan Digital Sky Survey (SDSS-DR14) quasar catalog. We performed a careful and homogeneous analysis of the SDSS Spectra of these sources, to estimate the continuum and line properties of several emission lines such as Hα, Hβ, Hγ, Mg ii, C iii], C iv and Lyα. From the derived emission line parameters, we estimated single-epoch virial black hole masses (MBH) for the sample using Hβ, Mg ii, and C iv emission lines. The sample covers a wide range in bolometric luminosity (logLbol; erg s – 1) between 44.4 and 47.3 and logMBH between 7.1 and 9.9 M⊙.
Here, you will find the entire spectral catalog in the FITS format. Moreover, spectral fitting plots (PDF format) and model components (FITS format) for each DR14 quasars are provided.
- The main catalog (“ dr14q_spec_prop.fits ”) is based on the spectral information from this study consisting of 274 columns, which are described in Table B4.
- An extended catalog (“ dr14q_spec_prop_ext.fits ”) where all the columns of DR14Q (Paris et al. 2018) are appended after the main catalog (ie, after column # 274). The extended catalog has a total of 380 columns.
- Spectral fitting plots of individual quasars.
Download the catalog, Plots, and models