
Online 3D-based participatory mapping for urban planning – pilot case shows usability challenges exist especially with smart phones
Salla Eilola & Nora Fagerholm, Department of Geography and Geology, University of Turku
In the spring 2021, the GreenPlace team together with two companies, Mapita and Sova3D, and the city of Turku developed and piloted an online mapping survey to gather Turku citizens’ views for urban planning. The novelty of the survey is in the use of a 3D visualization as the participatory mapping background. In this blog post, we reflect on the usability and potential of the 3D applications for urban planning based on the feedback received from the respondents.
3D city models and so-called digital twins are becoming commonplace in urban information management and expectations are mounting also on their use in engaging citizens in participatory planning (Billger et al., 2017; Lovett et al., 2015). The visual power of 3D attracts interest in communicating to and with citizens. There are promising signs of how digital 3D visualizations can support participatory urban planning (Jaalama et al., 2021; Virtanen et al., 2015).
With the pilot project, we were able to test how the existing 3D publishing tool by Sova3D can be combined with Mapita’s Maptionnaire online survey tool. Maptionnaire is a platform for promoting digital participation that places emphasis on place-based experiences of citizens and is used in numerous municipalities and cities around the world. The Maptionnaire survey platform was combined through application program interface with S3D-Maps providing the 3D view and functionalities to the survey. Sova3D has developed their web browser-based 3D publishing tool for municipalities, construction companies, and real estate investors. Our main interest was to test how citizens are able to perceive and use a 3D visualization within an online survey.
The pilot case was selected together with city planners and linked to an on-going planning process in one specific city block, Aninkainen. This area is an iconic part of the city centre as it houses the Concert Hall and large vocational school compound with significant 1950’s functional style architectural value. The aim of the survey was to increase knowledge of this specific part of the city and collect ideas for its future development.
The survey (bit.ly/Aninkainen) was targeted to over 15-year-old Turku residents and it was open three weeks in March-April 2021. In the survey, the respondent could read about the history and view photographs of the area, have a predetermined 3D fly-through around the area, navigate and click on information boxes in the 3D view, place future ideas on it using map markers (figure 1), and describe the ideas in words.

Figure 1. Screen capture of the online survey page in which respondents mapped their ideas. A popup window opened after placing a marker on the map and the respondent could in own words describe it. In total 135 respondents mapped their wishes in the 3D view, which resulted in 368 different ideas, i.e. map markers in different categories.
In the survey log, it can be observed that many respondents dropped out towards the end of the survey. Although this is a generally recognized downside of online surveys, interestingly, we noted that those who completed the entire survey used mainly a proper desktop computer. Out of those, who opened the survey using a computer with a large screen (n=234), 71 % quitted the survey at some point without finishing it, whereas 80 % of those using a tablet or a computer with a small screen (n=74) quitted. Notably, as much as 88 % of those using a smartphone (n=275) quitted without finishing. These results point to challenges faced with smartphones and tablets when responding to the survey and using the 3D functionalities. However, the result may also reflect that people on mobile devices have possibly less time to focus on taking part in a survey.
The usability challenges faced by smartphone users are evident also when looking at survey user feedback received from approximately 126 respondents with nearly equal gender distribution and most common age between 30-64 years. Out of those giving feedback 30 % had very little or no previous experience in using digital 3D visualizations.
Feedback showed that while 3-7 % of large-screen computer users (n=67) and 13 % of tablet users (n=15) reported usability of the various survey functions as difficult, as high as 22-38 % (n=31-32) of smartphone users considered them difficult or were unable to use them at all (see figure 2 showing an example of feedback on mapping functionality). The most common challenges or difficulties reported were slow rendering of the 3D view, task of mapping ideas using place markers, and navigating on the 3D view (figure 3). The difficulties in navigating and using the 3D-based mapping view highlights that focus should be placed on developing these functionalities in the 3D applications in order to more effectively collect citizens’ insights.
The usability challenges concern especially the smartphones. The small screens of smartphones limit the functionalities for complex tasks and map reading which hamper the user experience. The challenges are tricky as these devices are most widely available and frequently in use by people, and therefore, have high potential for advancing digital citizen participation.
Despite the difficulties, interestingly over half of all the respondents, who completed the survey, perceived the functionalities to be easy or very easy to use (n=124-125). Similarly, 84 % (n=125) of them would recommend the use of the 3D-based mapping solution for digital participation in planning. In fact, no one stated that they would not recommend it at all. These results encouragingly show that among those who had the skills and proper device to respond to the survey, found the experience very positive.

Figure 2. Answers to the feedback question ”How did you experience the task to place markers in the 3D view?” categorized based on the device used by the respondent.
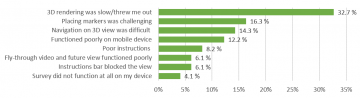
Figure 3. The most commonly mentioned challenges in using the online 3D-based survey tool reported by the respondents. Altogether challenges were reported by 35 % of the respondents (n=124).
Due to COVID-19 restrictions, we were unable to conduct facilitated mapping exercises with an opportunity to observe how people interacted with the 3D map view and used the functionalities. The usability evaluation, thus, left us with more questions than we were able to answer. In future research and development, we recommend a systematic usability evaluation including people with different backgrounds.
While web-based solutions potentially reach people more widely and easier, the digital divide due to varying skills, competencies and access to technological devices (Van Dijk, 2017) urges practitioners to consider carefully when these tools are most appropriate for participatory urban planning. In our case, while gender balance was fairly good among respondents, unemployed, retired and minority groups were underrepresented. The usability of digital participatory tools among these various groups is a concern highlighted by the Turku city planners involved in the pilot study. The joint aim is to reach wider public representation and higher response rate, in order to provide convincing data of the needs and wishes of the residents for developing more inclusive cities.
Overall, the pilot case was a successful collaborative effort with planning professionals and two software companies eager to pilot and further develop their technological solutions. The case showed that researcher-practitioner-software developer collaboration is mutually beneficial for testing practical solutions fit for planning process. The 3D city model of Turku will be integral part of urban planning process in the future and the planners stated the pilot gave them valuable insights on how it can be used with citizens, for example, that 3D visualisation offers citizens a possibility to study the planned area from different perspectives.
A full report of the survey results can be found in Finnish:
Eilola, S., Kollanen, P., & Fagerholm, N. (2021). Vehreytttä ja rentoa oleskelutilaa kaivataan Aninkaisten konserttitalon kortteliin – Raportti 3D-näkymiä pilotoivan asukaskyselyn tuloksista ja käyttökokemuksesta. Turun yliopiston maantieteen ja geologian laitoksen julkaisuja no. 16. Avoimesti saatavilla täältä.
References:
Billger, M., Thuvander, L., Wästberg, B.S., 2017. In search of visualization challenges: The development and implementation of visualization tools for supporting dialogue in urban planning processes. Environ. Plan. B Urban Anal. City Sci. 44, 1012–1035. https://doi.org/10.1177/0265813516657341
Jaalama, K., Fagerholm, N., Julin, A., Virtanen, J.-P., Maksimainen, M., Hyyppä, H., 2021. Sense of presence and sense of place in perceiving a 3D geovisualization for communication in urban planning – Differences introduced by prior familiarity with the place. Landsc. Urban Plan. 207, 103996. https://doi.org/10.1016/j.landurbplan.2020.103996
Lovett, A., Appleton, K., Warren-Kretzschmar, B., Von Haaren, C., 2015. Using 3D visualization methods in landscape planning: An evaluation of options and practical issues. Landsc. Urban Plan. 142, 85–94. https://doi.org/10.1016/j.landurbplan.2015.02.021
Van Dijk, J., 2017. Digital divide: Impact of access, in: The International Encyclopedia of Media Effects. Wiley, Hoboken, pp. 1–11.
Virtanen, J.-P., Puustinen, T., Pennanen, K., Vaaja, M.T., Kurkela, M., Viitanen, K., Hyyppä, H., Rönnholm, P., 2015. Customized Visualizations of Urban Infill Development Scenarios for Local Stakeholders. J. Build. Constr. Plan. Res. 03, 68–81. https://doi.org/10.4236/jbcpr.2015.32008