Identifying citizens’ mobility patterns in Finnish cities – introducing Transformative Cities
Last autumn, 26,000 residents of Oulu, Espoo, and Lahti received personal invitations to participate in a mobility lifestyle study. We had designed a random sample study to collect data on daily travel patterns, as well as on attitudes and preferences towards mobility choices and neighborhood characteristics. These efforts are part of Transformative Cities project – funded by the Research Council of Finland – which aims to identify new ways to support carbon neutrality, sustainable lifestyles, and biodiversity conservation in cities. The results of our work package will be released along with my PhD research papers.
Thousands of respondents – actually more than 4,000 – diligently responded to our public participation GIS (PPGIS) survey by placing their home locations and everyday destinations on the map and answering to a series of questions regarding personal background, travel mode use, and perceived health. We were extremely pleased with the motivation to respond – with a city-specific response rate of 15–16%.
The burning research questions
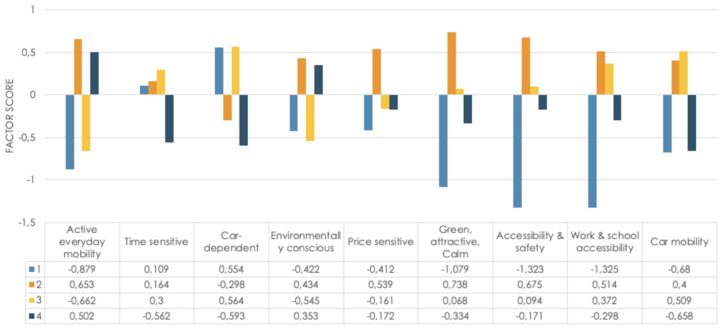
The first point of interest in our study is to shed light on what kind of lifestyle personas we can identify in terms of mobility and residential preferences. For this purpose, we start our journey of analysis with non-spatial statements of around 30 questions of preference. By conducting a factor analysis, we managed to distill the statements into less than ten components, which are best explaining the differences among respondents’ views (Figure 1). Further, with clustering methods we yielded four distinct lifestyle personas in each of the cities. These profiles are characterized by their fondness to move actively, car-dependency, sensitivities to money- and time-use and preference of accessibility and greenery, for example. Interpretation of the results is currently ongoing, but we are already seeing clear patterns in each study city.
Figure 1. Average component values for clusters in Oulu. In this specific case, we identified four distinct lifestyle clusters, colors represent different clusters.
With this data, we aim to conduct a series of non-spatial and spatial statistical analyses. After the profiling, each cluster will be further characterized with respondent specific information. Eventually, this data will be essential in each publication of my PhD investigation.