Pulsed-Wave Doppler of Mitral Inflow
E- and A-waves
If the patient is in sinus rhythm, two distinct waves are seen during diastole when the mitral valve opens. These are recorded using pulsed-wave (PW) Doppler and represent blood flow into the left ventricle:
- The E-wave (from early) is generated when the mitral valve opens. Blood flows into the left ventricle because left atrial pressure exceeds left ventricular pressure at this stage of diastole.
- The A-wave (from atrium) is generated by left atrial contraction, which actively propels blood into the left ventricle.
Mitral inflow measurement using pulsed-wave Doppler is illustrated below.
Note. In atrial fibrillation, the left atrium no longer contracts effectively but fibrillates chaotically. Consequently, the A-wave is absent.
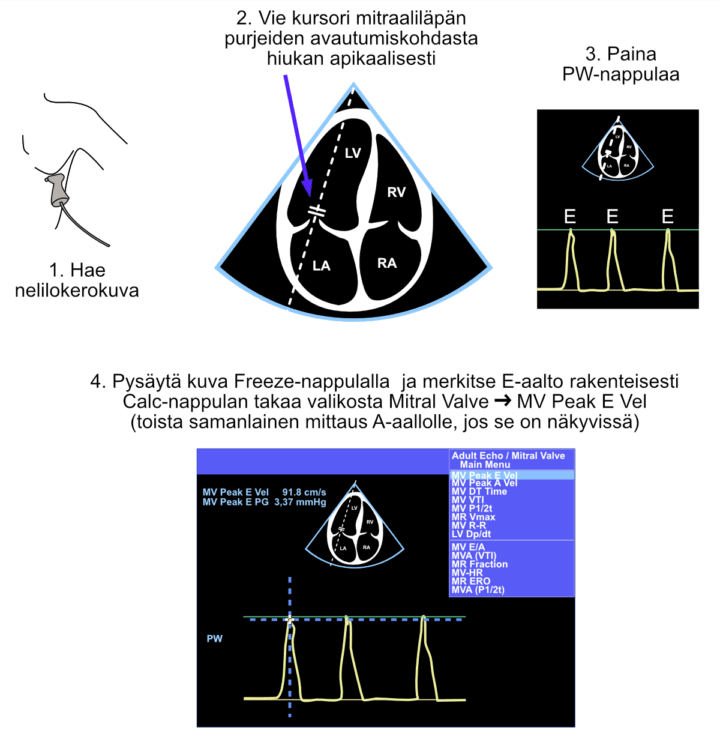
Figure: Pulsed-wave Doppler measurement of mitral inflow from the apical four-chamber view. In this illustrative example, the patient is in atrial fibrillation, so only E-waves are present (note the irregular rhythm).
Video: Pulsed-wave Doppler measurement of mitral inflow from the apical four-chamber view.
E- and A-wave Interpretation
The most important measurements are the peak velocities of the E- and A-waves. These velocities—and particularly their ratio (E/A)—provide valuable information about left ventricular diastolic function.
- Young healthy individuals
- E-wave greater than A-wave
- E/A ratio > 1.0
- Mild diastolic dysfunction and normal aging
- Reversal of the E/A ratio
- E/A ratio < 1.0
- More advanced diastolic dysfunction
- Pseudonormal mitral inflow pattern
- E/A ratio > 1.0
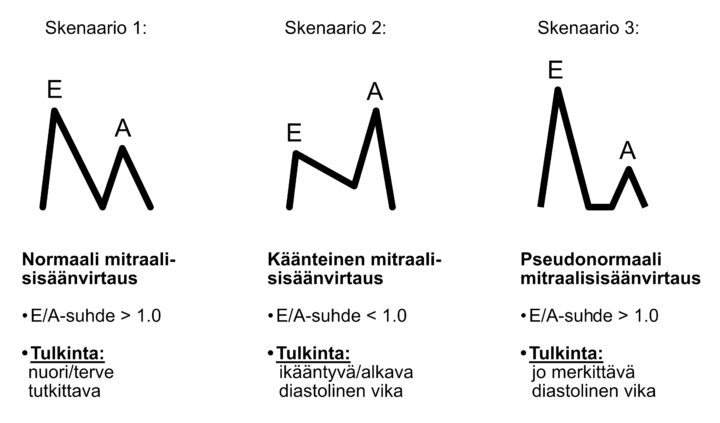
Figure: Common mitral inflow patterns. Distinguishing between a normal and pseudonormal E/A ratio often requires the use of tissue Doppler imaging.
Because scenarios 1 and 3 appear visually similar, beginners often wonder how normal and pseudonormal filling patterns can be distinguished. In practice, experienced echocardiographers rarely have difficulty making this distinction. The patient’s age together with the other echocardiographic findings usually provides the answer.
A useful practical rule is that a “normal” E/A ratio in an older patient is rarely truly normal. In elderly patients, mitral inflow is usually either impaired relaxation (scenario 2) or pseudonormal filling (scenario 3). Although simple, this rule is surprisingly underemphasized in the literature.
Distinguishing between a normal and pseudonormal E/A ratio often requires the use of tissue Doppler imaging.