Aortic Stenosis
According to the European Society of Cardiology (doi:/10.1093/eurheartj/ehab395), aortic stenosis is the most common valvular heart disease requiring an invasive intervention in Europe and North America.
A clinician learning echocardiography quickly learns that severe aortic stenosis can often be suspected—or confidently excluded—by visual assessment alone, without quantitative continuous-wave or pulsed-wave Doppler measurements.
The following sections describe the key echocardiographic methods used in the assessment of aortic stenosis.
Visual Examination
The parasternal long-axis (PSLAX) and parasternal short-axis (PSAX) views are particularly useful for assessing aortic valve opening. If the valve is heavily calcified and leaflet excursion is markedly restricted, aortic stenosis should be suspected.
Color Doppler
If blood flow is unobstructed, the color Doppler signal appears uniform, reflecting laminar flow. When blood passes through a narrowed valve orifice, the flow becomes turbulent, producing a characteristic mosaic color Doppler pattern with prominent yellow hues caused by aliasing. Whenever turbulent flow is observed across the aortic valve, aortic stenosis should be considered until proven otherwise.
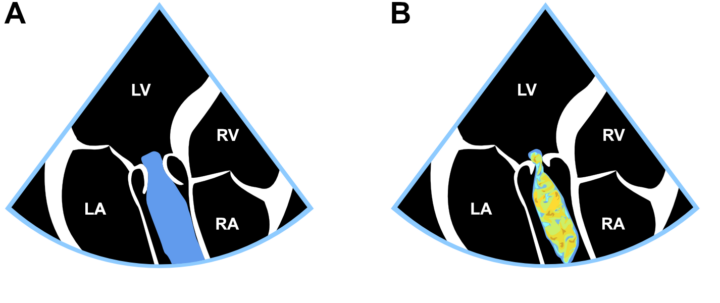
Figure: Laminar (A) and turbulent (B) flow.
Continuous-Wave Doppler
Continuous-wave (CW) Doppler is central to the echocardiographic assessment of aortic stenosis. The measurement technique is illustrated below.
My personal rule of thumb is that if a quick measurement made with the Caliper tool already shows a peak velocity of at least 4.0 m/s (corresponding to an approximate pressure gradient of 64–65 mmHg between the left ventricle and the aorta), the diagnosis of severe aortic stenosis is usually evident, and additional structured measurements using the Calc menu are not always necessary.
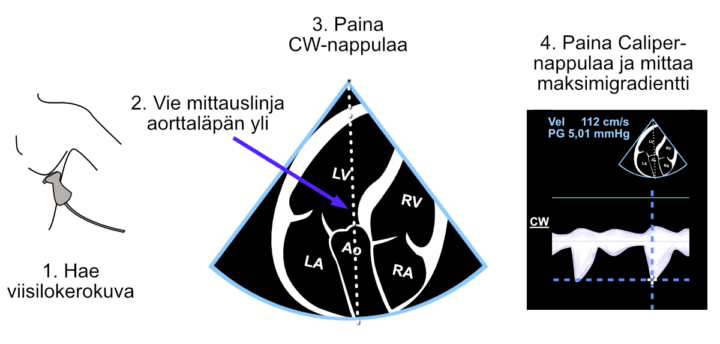
Figure: Measuring the aortic valve pressure gradient “unnamed” using the Caliper tool from the continuous-wave Doppler signal. The image shows the alternative apical four-chamber orientation.
Video: Measuring the pressure gradient across the aortic valve using the CW Doppler envelope (VTI and peak velocity). The video uses the standard apical four-chamber orientation.
If the velocity estimated with the Caliper tool suggests moderate rather than severe aortic stenosis, the aortic valve area (AVA) should also be calculated using the continuity equation. In this situation, a velocity measured with the Caliper tool cannot be used, because the echocardiography system does not recognize which parameter has been measured. Instead, the measurement must be performed structurally using the AV Vmax (or AV VTI) parameter. The continuity equation is described in the following section.